
Prove Your ROI and
Stop Guessing.
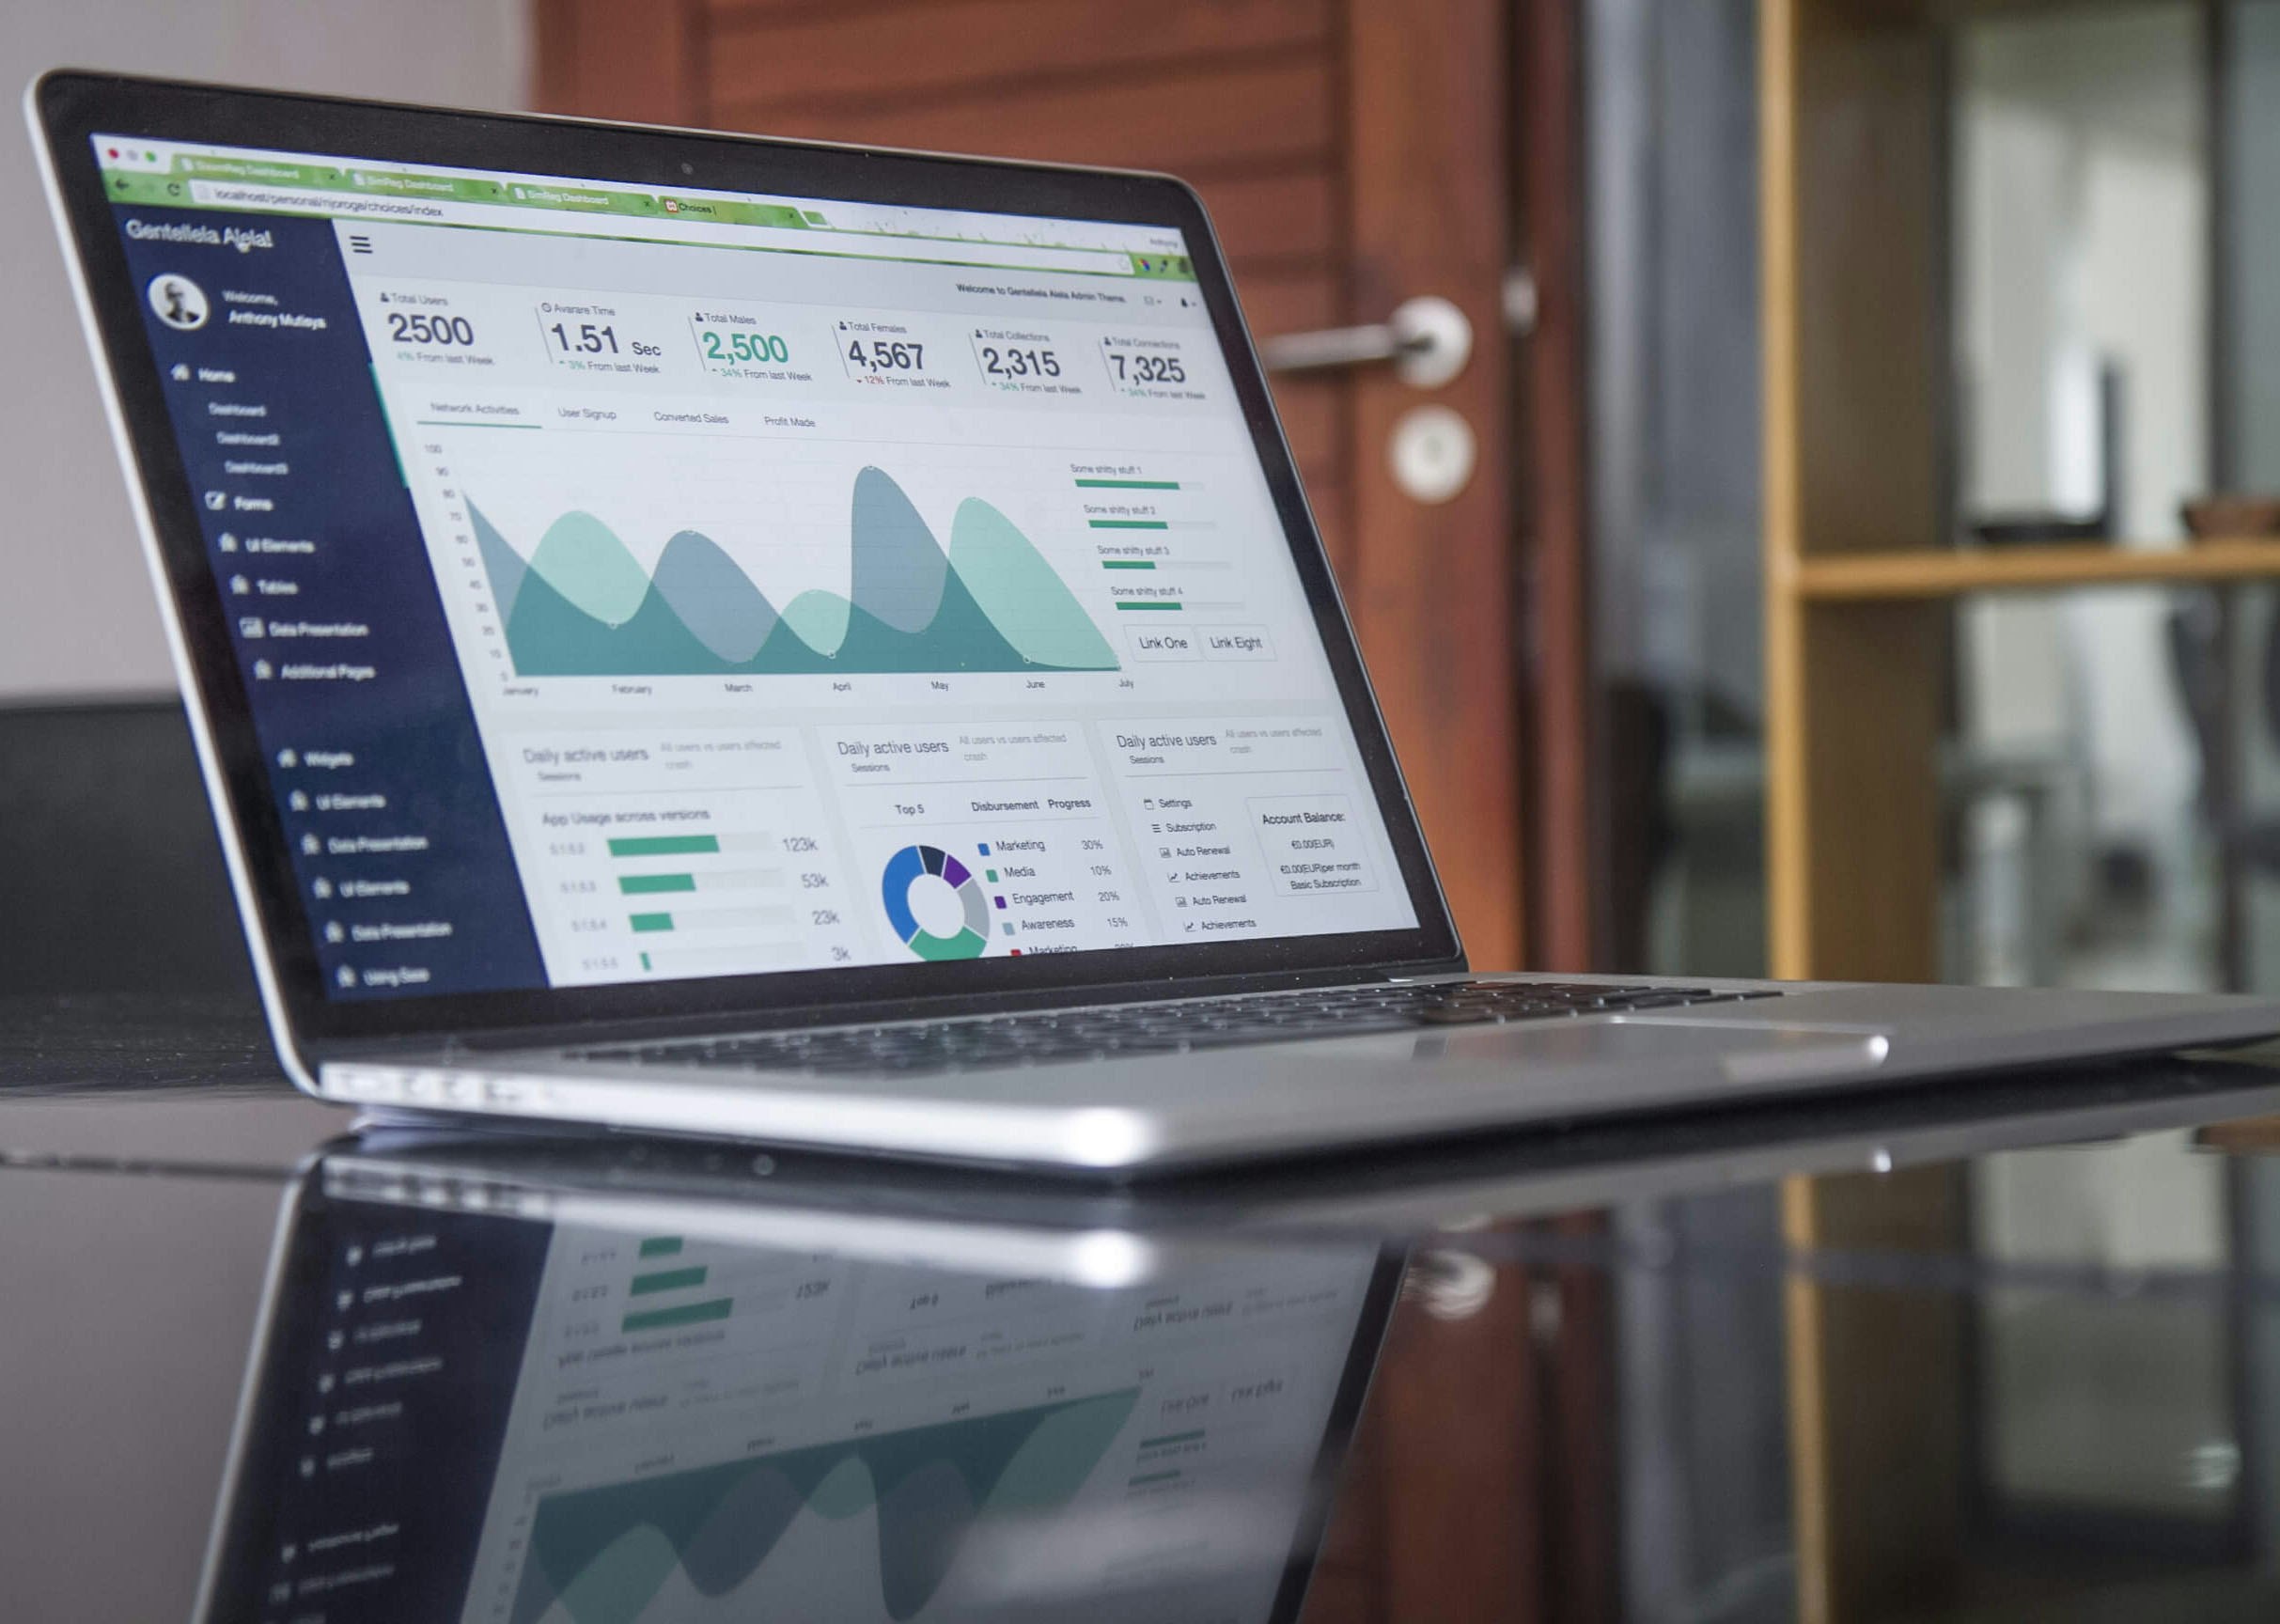
Shift your focus from vanity metrics to conversion metrics. Our built-in reporting instantly links every click and conversation directly to a dollar value.

The Scorecard: Sales & Pipeline Metrics
Your sales and operations center. Answer the fundamental question: How healthy is our sales process?
Opportunity Value & Bottlenecks
Monitor the aggregated value of every lead in your pipeline. Easily spot where opportunities are stalling so you can refine your pitch.
Conversation & Stage Rates
Identify the weakest link in your system. Measure the percentage of leads that successfully move from one stage to the next.
Manual Activity Report
Track completed actions like calls made, texts sent, and emails replied to. Ensure your team is hitting their activity targets.
The GPS: Attribution Reporting
This is where marketing teams prove their worth. Connect the revenue you make to the source of the traffic, allowing you to stop guessing and start scaling what works.
First Touch vs. Last Touch
Understand the full customer journey by seeing exactly which interaction first brought them in and which one finally closed the deal.
Sources of Leads
See a clear visual breakdown of where your opportunities originate (Organic Search, Social Media, Paid Ads) to prove ROI for marketing channels.

The Optimization Engine
Data is useless unless you act on it. Facilitate a continuous feedback loop that allows you to automate, measure, and refine instantly.
Connecting Ad Spend to Revenue
Go beyond Cost Per Lead. Link your Google and Facebook Ad spend directly to actual revenue, Cost Per Appointment Show, or Cost Per Sale.
Continuous Optimization Cycle
Automate, measure, and refine instantly. Analyze weak points, hypothesize solutions, test new workflows, and measure the results.
Custom Dashboards by Role
Create tailored views for Sales Reps (activity), Marketing Managers (attribution), and Executives (total revenue forecast).
Comprehensive Tracking
Monitor every interaction across your business. From the first phone call to the final scheduled meeting, BeeslyAI™ tracks it all.
Phone Call Metrics
Track answered calls, missed calls, call sources, and total call volume. Review past conversations to improve sales training.
Meeting & Appointment Statistics
Monitor confirmed bookings, completed appointments, no-shows, and canceled meetings to optimize your booking process.
Agency-Grade Reporting
Gain a competitive edge. Instead of pulling data from multiple tools, have everything you need in one unified dashboard.
Campaign-Level Tracking
See exactly which funnels, ads, and automations drive the most ROI.
Cross-Channel Reporting
Track performance across email, SMS, calls, and ads all in one place.
Client-Specific Dashboards
Provide custom insights for each client, giving you a competitive edge.
Real-Time Updates
Monitor campaigns as they happen, not days later. Everything in one dashboard.
Metrics That Actually Matter
Not all metrics are created equal. Some numbers look impressive but don't move the needle. Tracking these inside BeeslyAI™ ensures you see results that tie directly to revenue.
Lead Conversion Rate
How many leads are actually turning into paying customers?
Cost Per Lead (CPL)
Are your campaigns profitable? Track your exact acquisition costs.
Customer Lifetime Value
Are clients' customers staying longer & spending more?
Pipeline Value
How much money is currently sitting in your active pipeline?
Response Rate
Are your automations and follow-ups actually driving engagement?